/https%3A%2F%2Fassets.over-blog.com%2Ft%2Fnullified%2Fimages%2F105.jpg)
Life and Death of an application Part 3: From Build to RUN
In the previous articles of this serie "Life and Death of an application" we oversaw how to develop easily a web app plugged into a Big Data service (Google Directions). Then, we saw how to design the architecture that will run it by leveraging the different artifacts (code, conf script) and create a "converged blueprint" to merge these Dev artifacts with Ops services (servers, storage, network and security services).
Now, come the Fun part, we are going to request the service, see which actions we can make once it's deployed and, then, see how Ops can actually help us make sure the application keep RUNNING in the long term.
Ready? Go!
I want my application to be built!
Yes Sir. No problem Sir. Here you go.
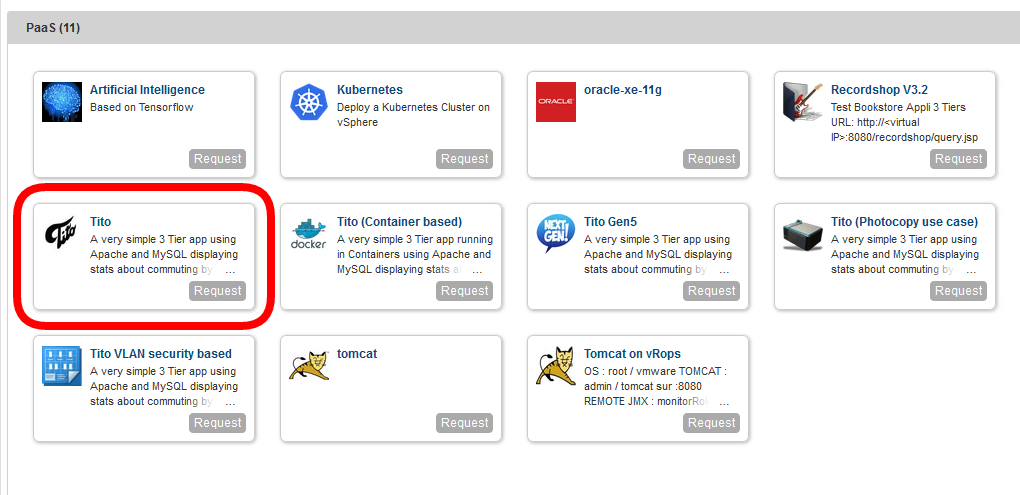
Simply pick up your application in the catalog:
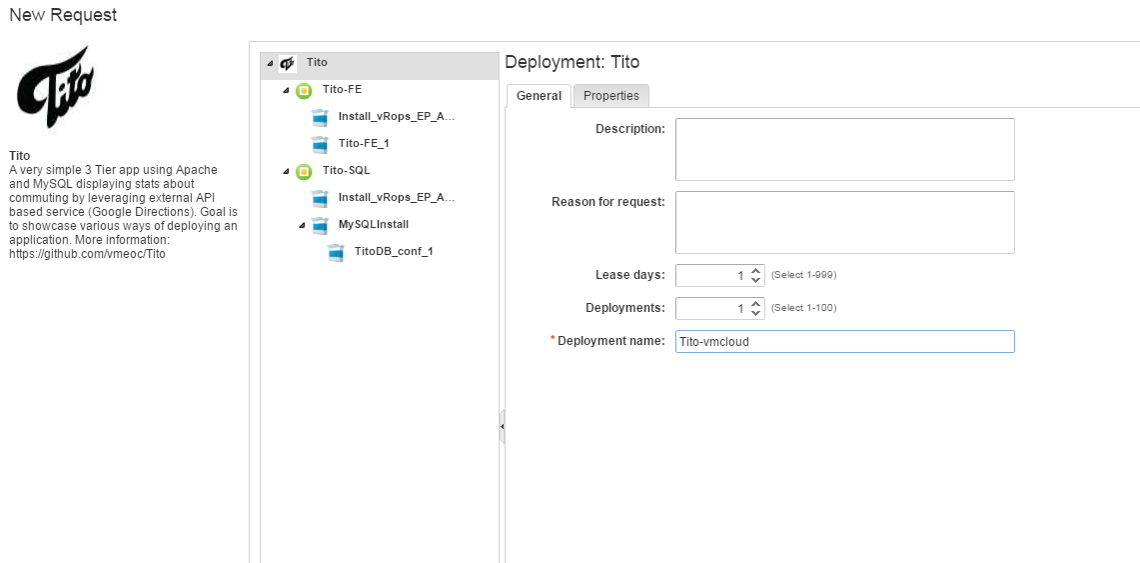
then you have a quick form asking you which settings you want to change. For example, how long you need it, how you want to name the whole deployment (VMs are automatically named here as per our cloud admin policy) and how many application instances you want to deploy.
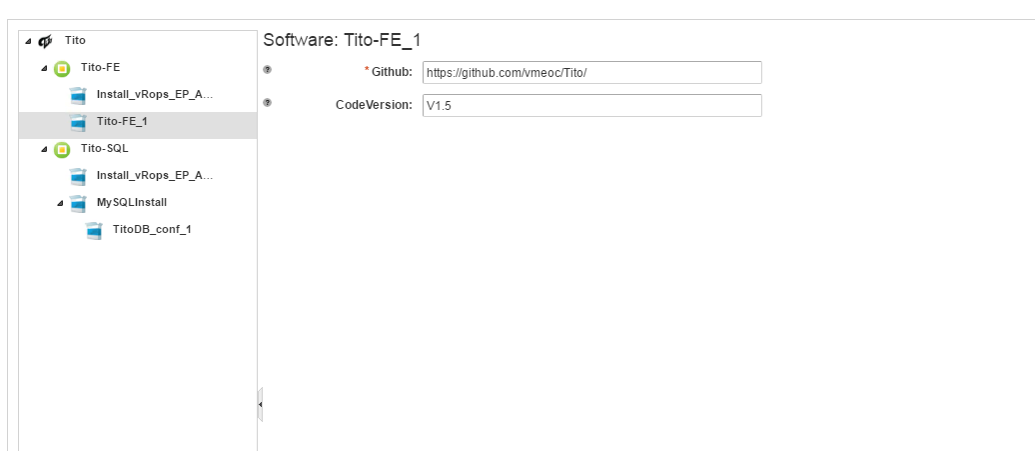
When you click on your Front End app component, you can set the repository you need and the version you want to deploy.
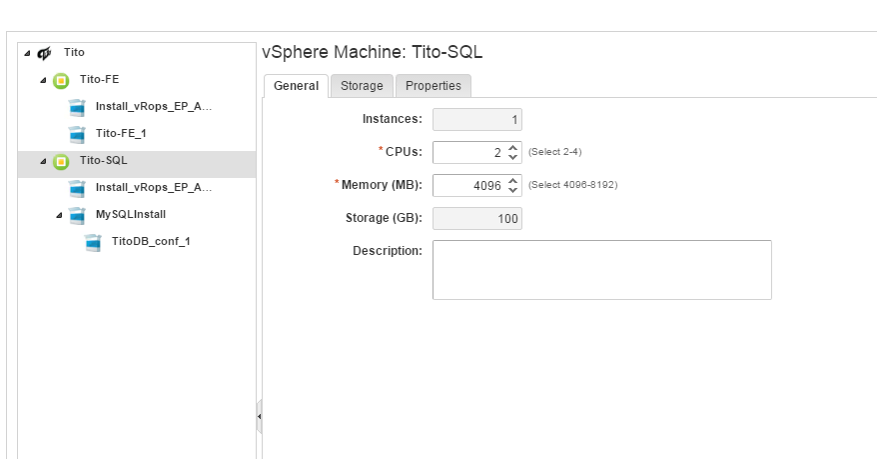
Want more power to run your database? Simply pick up the CPU and RAM resources you need. Then click submit.
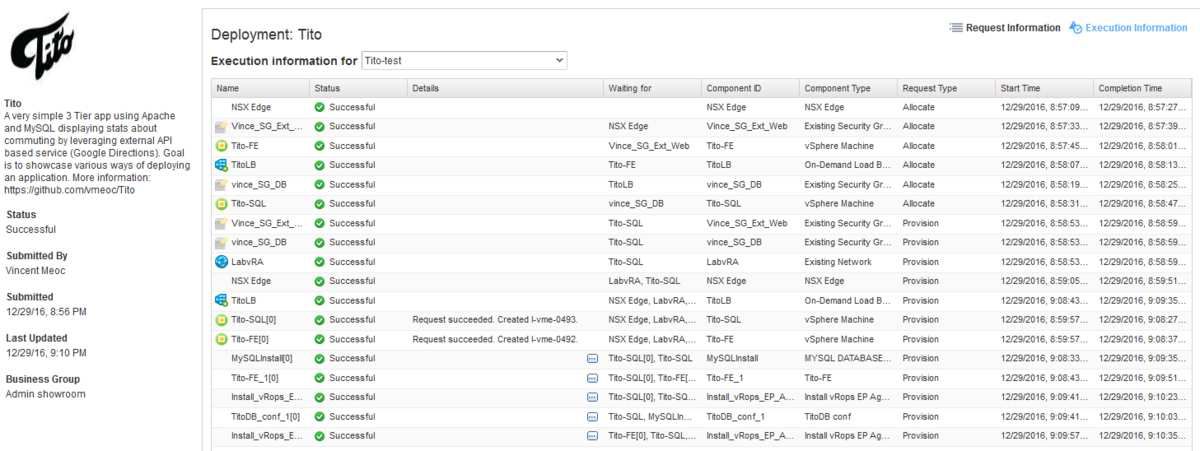
That's it! Your request now go through different stages. It gets automatically approved if we have not been to greedy regarding resources, the application get deployed at the right place in the right datacenter, get an IP address and a name according to my Ops policy, the DNS get updated, VMs get deployed, Load balancer too, security get applied at the VM level, Apache get installed, MySQL too, the code is retrieved from github, the Database is configured, the front end get the IP of the database and.... that's it: your application has been built.
the build process can be followed here:
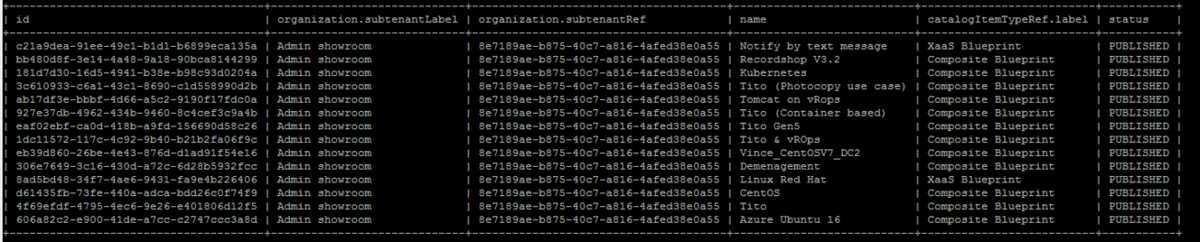
Hold on a moment, that's all fine but you may be more a CLI fanatic than a portal fanatic or you may want to connect your Jenkins to actually automatically trigger your application deployment. That's where the REST API or the CLI become handy.
As an example, if you type
vra catalog list
Here's the output:
How do I request my service? Very easy, you simply generate a JSON file, customize it (deployment name, code version, CPU number, etc...) and run this command
vra catalog request submit --inputfile Tito-request.json
Thanks. I've got my whole application deployed in 15mn. Now, I need to modify some bits....
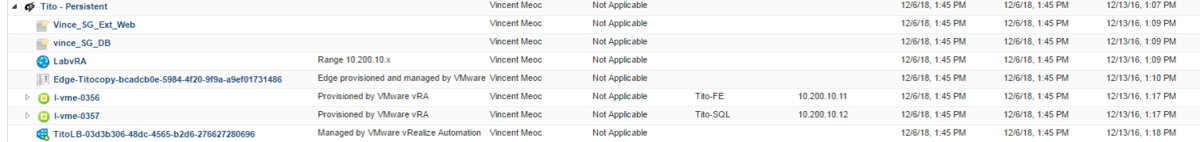
you can now see all the different components of your application and apply operations on each of them or on the whole application.
For example, you can scale out and scale in your whole application which will create new Front end and will update the load balancer.
On the VM components, you can connect directly through the console, create/delete snapshots, destroy/reset/redeploy/reconfigure.
If you need a particular operation, the list can be extended.


There's a lot of moving parts here, how do I track/monitor this?
Ok, we're getting in the RUN phase here. Basically, how do I understand the relationships between the different components, troubleshoot issues, monitor the performance/availability, provide the right information to the right people, etc... etc...
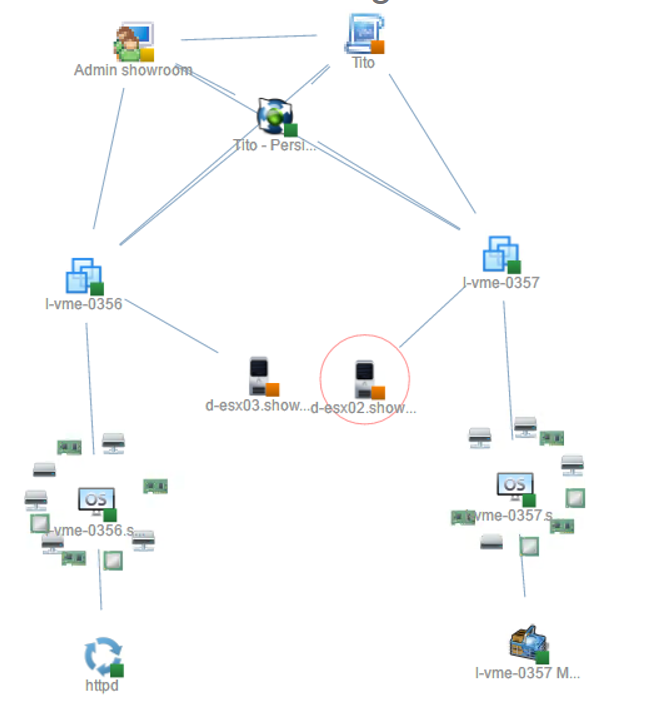
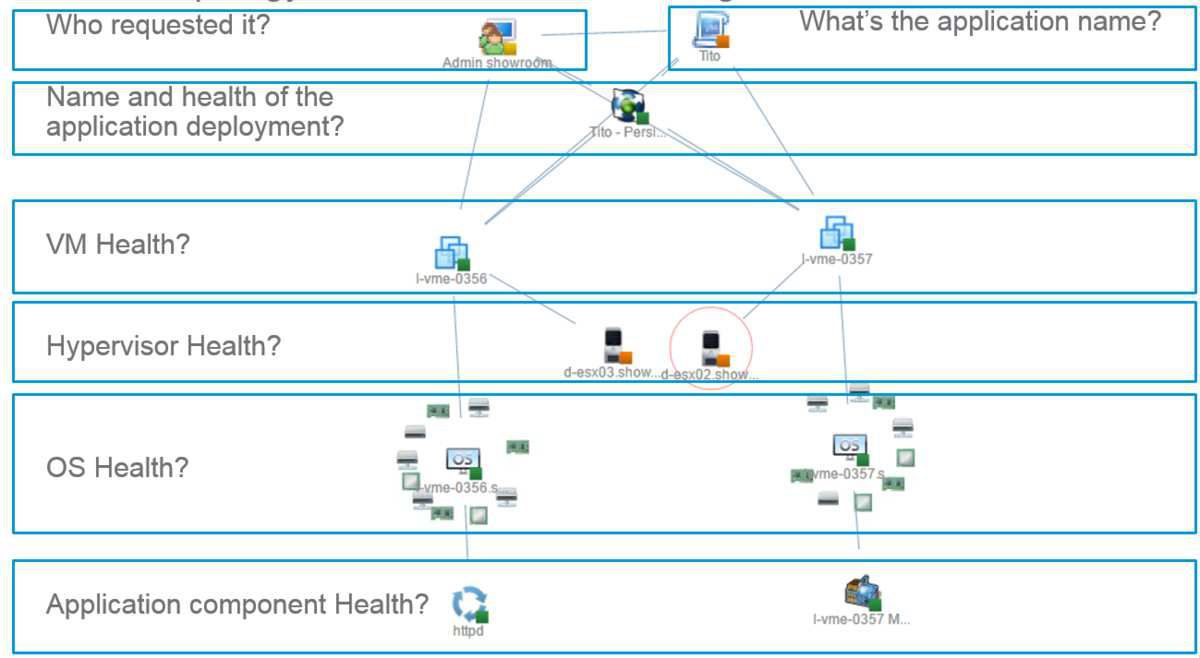
Here is an example of the kind of topology you can show to describe the relationships of the different components. There are many other ways to show all the information we have from the SDDC but I like this view which show at a glance what's linked to what.
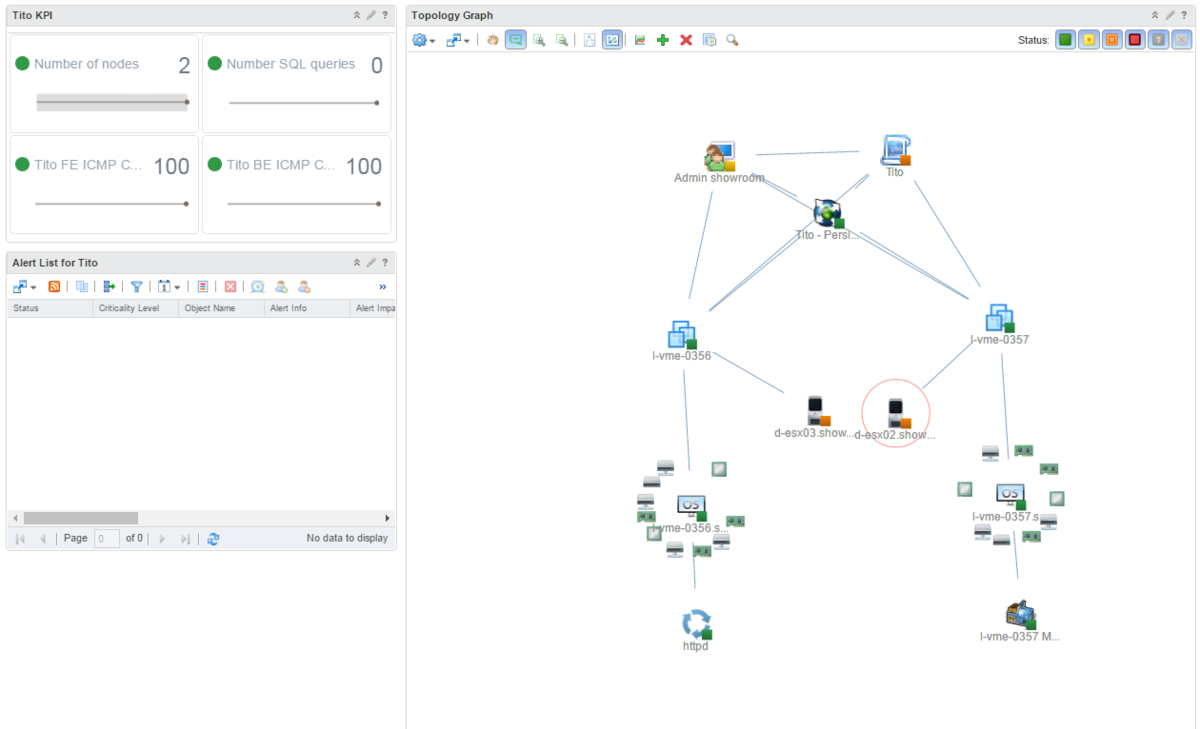
Another example of a dashboard which can be provided to monitor Tito specifically.
Here we take into account the availability, the storage/CPU/RAM/Network performance as well as the application components performance.
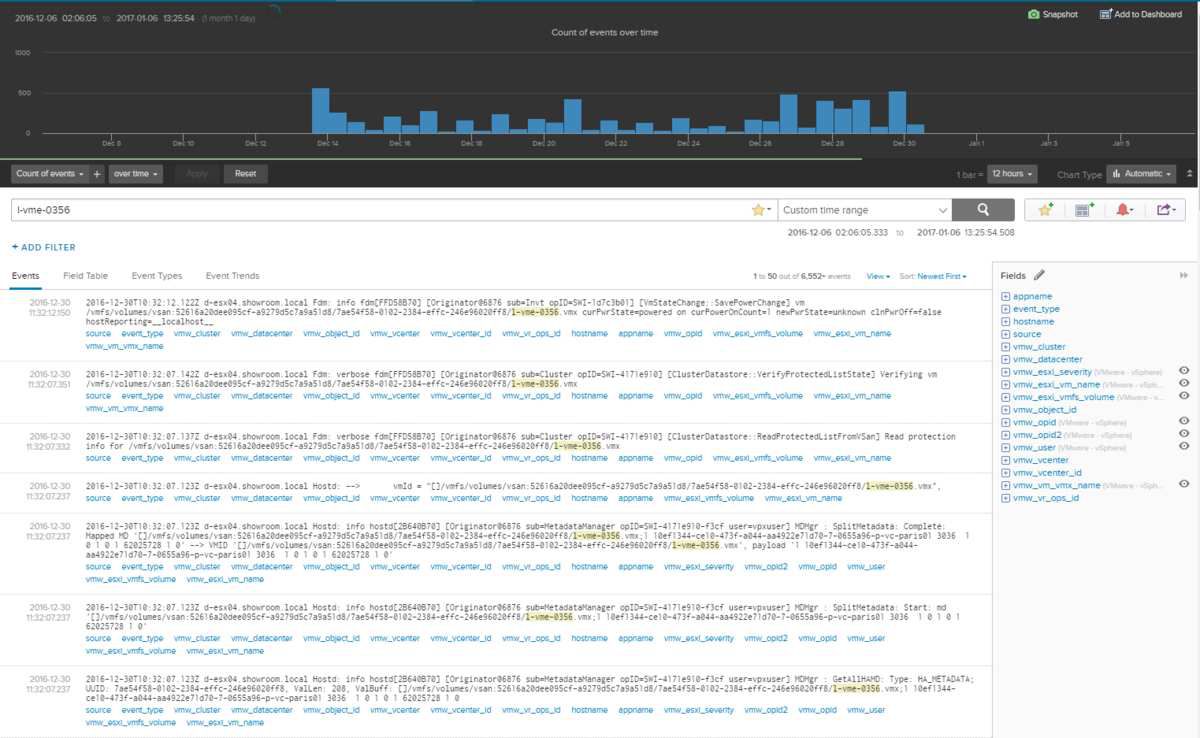
We also leverage the logs from the virtual infrastructure as well as the one from the application. We store, analyse them and represent them graphically for an easier consumption.
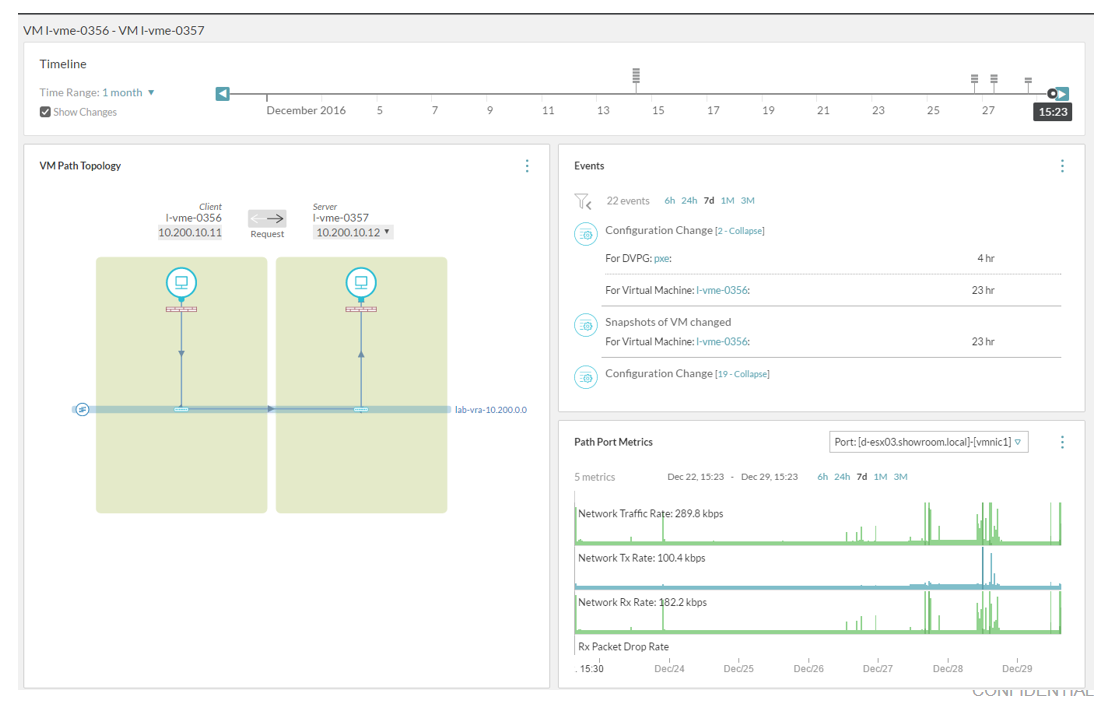
Finally, we automatically build the network topology map showcasing the different hop (virtual, physical, router, L2, etc..) that a packet need to take between the various components.
I hope you found this interesting. In a future article we'll get back to the design phase to see how we can play with the SDDC to answer various application architecture need.
If you liked this article, feel free to share it.


/image%2F1531135%2F20220923%2Fob_dd6282_main.jpg)
/https%3A%2F%2Fi.ytimg.com%2Fvi%2FbJJRSlt-vFg%2Fhqdefault.jpg)
/image%2F1531135%2F20171227%2Fob_317c06_hybrid-bp.png)
/http%3A%2F%2Fi.ytimg.com%2Fvi%2FfseZ8EWzels%2Fhqdefault.jpg)